Particulate matter and coal dust: Difference between revisions
No edit summary |
|||
| (15 intermediate revisions by the same user not shown) | |||
| Line 8: | Line 8: | ||
== Coal Dust Emissions == | == Coal Dust Emissions == | ||
Coal dust is produced through physical processes that wear on the brittle coal rocks during mining, transport, and storage to generate coal particles that are then uplifted to the atmosphere and carried by winds. There are various physical disturbances that can create small coal particles and uplift them into the air. The distance traveled by coal dust in the atmosphere depends on the size of particles, with smaller particles generally reaching farther distances as they settle more slowly because they less affected by gravity, and the conditions of the atmosphere. Physical disturbances influencing coal dust emissions and downwind impacts include weather and wind patterns and the transporting and handling of coal. | Coal dust is produced through physical processes that wear on the brittle coal rocks during mining, transport, and storage to generate coal particles that are then uplifted to the atmosphere and carried by winds. There are various physical disturbances that can create small coal particles and uplift them into the air. The distance traveled by coal dust in the atmosphere depends on the size of particles, with smaller particles generally reaching farther distances as they settle more slowly because they less affected by gravity, and the conditions of the atmosphere. Physical disturbances influencing coal dust emissions and downwind impacts include weather and wind patterns and the transporting and handling of coal. | ||
=== Wind and weather disturbances === | === Wind and weather disturbances === | ||
| Line 15: | Line 15: | ||
In January 1987, the [[Virginia Air Pollution Control Board|Virginia Air Pollution Control Board (APCB)]] published a study on coal dust emissions from the terminals in Southeast Newport News: [[:File:Coal Study-January 1987 21391318.pdf|Control of Fugitive Emissions from Open Coal Storage in Newport News, Virginia]]. As part of this study, researchers developed a mathematical formula for the effective wind forces (''K<sub>t</sub>'') on the terminals' coal piles using readily available meteorological measurements. | In January 1987, the [[Virginia Air Pollution Control Board|Virginia Air Pollution Control Board (APCB)]] published a study on coal dust emissions from the terminals in Southeast Newport News: [[:File:Coal Study-January 1987 21391318.pdf|Control of Fugitive Emissions from Open Coal Storage in Newport News, Virginia]]. As part of this study, researchers developed a mathematical formula for the effective wind forces (''K<sub>t</sub>'') on the terminals' coal piles using readily available meteorological measurements. | ||
<math>K_t = SP\left ( \frac{T}{RH} \right )\left ( \frac{P}{\mu\times1.68} \right )</math> | |||
[[File:Figure 3 Control of Fugitive Emissions from Open Coal Storage in Newport News, Virginia.png|thumb|The relationship between the measured total airborne partic<nowiki/>le concentration and the daily summed Kt for those sample days. This line is labeled TSPunc/t. The second line, labeled CEunc, shows only the un-combusted coal portion of those measured particles. The title reflects that the total particles were measured using a hi-volume sampler and "E''K<sub>t</sub>''" should read "Σ''K<sub>t</sub>''". This is figure 3 in the 1987 study [[:File:Coal Study-January 1987 21391318.pdf|Control of Fugitive Emissions from Open Coal Storage in Newport News, Virginia]].<ref name=":0">Air Pollution Control Board, Hampton Roads Region, [[:File:Coal Study-January 1987 21391318.pdf|Control of Fugitive Emissions from Open Coal Storage in Newport News]], Virginia, January 1987.</ref>]] | |||
[[File:Figure 3 Control of Fugitive Emissions from Open Coal Storage in Newport News, Virginia.png|thumb|The relationship between the measured total airborne | |||
SP is the wind speed in miles per hour, T is air temperature in °F, RH is relative humidity (%), P is the air density in pounds (lbs) per cubic feet, and μ is the air viscosity in lbs per cubic feet hours. The constant of 1.68 is the value of P divided by μ at standard conditions of 70°F, RH of 60%, and P of 29.92 inches Hg. The term T/RH reflects the tendency of the coal piles to emit particles when temperatures are high and/or RH is low.<ref name=":0" /> Hot, dry, and windy atmospheric conditions present a worst case scenario for coal dust emissions.<ref name=":1" /> | SP is the wind speed in miles per hour, T is air temperature in °F, RH is relative humidity (%), P is the air density in pounds (lbs) per cubic feet, and μ is the air viscosity in lbs per cubic feet hours. The constant of 1.68 is the value of P divided by μ at standard conditions of 70°F, RH of 60%, and P of 29.92 inches Hg. The term T/RH reflects the tendency of the coal piles to emit particles when temperatures are high and/or RH is low.<ref name=":0" /> Hot, dry, and windy atmospheric conditions present a worst case scenario for coal dust emissions.<ref name=":1" /> | ||
The APCD developed the equation for ''K<sub>t</sub>'' to guide and optimize wet dust suppression with sprayers in Southeast Newport News. Their 1987 study found a strong relationship between the daily summed ''K<sub>t</sub>'' (Σ''K<sub>t</sub>'') and the amount of particles measured using a high-volume air sampler. The 1987 APCB study cited a 1984 study from the [[U.S. Environmental Protection Agency (EPA)]] Office of Air, Noise and Radiation, and the Office of Air Quality Planning and Standards as having reported that dust emissions can become significant at winds of 12 miles per hour.<ref name=":1">EPA Office of Air, Noise and Radiation, and the Office of Air Quality Planning and Standards, [[:File:Compilation of Air Pollution Emission Factors.pdf|Compilation of Air Pollution Emission Factors]], January 1984.</ref> We note that we | The [[Virginia Air Pollution Control Board|APCD]] developed the equation for ''K<sub>t</sub>'' to guide and optimize wet dust suppression with sprayers in Southeast Newport News. Their [[:File:Coal Study-January 1987 21391318.pdf|1987 APCB study]] found a strong relationship between the daily summed ''K<sub>t</sub>'' (Σ''K<sub>t</sub>'') and the amount of particles measured using a high-volume air sampler. The [[:File:Coal Study-January 1987 21391318.pdf|1987 APCB study]] cited a 1984 study from the [[U.S. Environmental Protection Agency (EPA)]] Office of Air, Noise and Radiation, and the Office of Air Quality Planning and Standards as having reported that dust emissions can become significant at winds of 12 miles per hour.<ref name=":1">EPA Office of Air, Noise and Radiation, and the Office of Air Quality Planning and Standards, [[:File:Compilation of Air Pollution Emission Factors.pdf|Compilation of Air Pollution Emission Factors]], January 1984.</ref> We note that we only found a [[:File:Compilation of Air Pollution Emission Factors.pdf|related report from 1985]].<ref name=":1" /> | ||
'''Clouds, rain, and fog:''' Coal dust emissions are reduced on cloudy, rainy, foggy, and humid days. This is similar to the use of water sprayers for [[Wet Dust Suppression|wet dust suppression]]. | '''Clouds, rain, and fog:''' Coal dust emissions are reduced on cloudy, rainy, foggy, and humid days. This is similar to the use of water sprayers for [[Wet Dust Suppression|wet dust suppression]]. | ||
| Line 31: | Line 29: | ||
* Like rain, fog cools the piles, and the very small fog droplets contribute to particle encapsulation that limit emissions. | * Like rain, fog cools the piles, and the very small fog droplets contribute to particle encapsulation that limit emissions. | ||
* Relative humidity influences coal dust particle size, with higher humidity associated with larger particles as the dust particles clump together. Lower humidity increases the overall concentration and the amount of fine dust particles specifically.<ref>Peng et al., [https://www.sciencedirect.com/science/article/abs/pii/S0016236118318714#:~:text=The%20results%20show%20that%20the,diluter%20and%20Nafion%20drying%20tube The effect of moisture on particulate matter measurements in an ultra-low emission power plant], ''Fuel,'' 238, 430–439, doi:10.1016/j.fuel.2018.10.140, 2019.</ref> | * Relative humidity influences coal dust particle size, with higher humidity associated with larger particles as the dust particles clump together. Lower humidity increases the overall concentration and the amount of fine dust particles specifically.<ref>Peng et al., [https://www.sciencedirect.com/science/article/abs/pii/S0016236118318714#:~:text=The%20results%20show%20that%20the,diluter%20and%20Nafion%20drying%20tube The effect of moisture on particulate matter measurements in an ultra-low emission power plant], ''Fuel,'' 238, 430–439, doi:10.1016/j.fuel.2018.10.140, 2019.</ref> | ||
In [[:File:Coal Study-January 1987 21391318.pdf|Control of Fugitive Emissions from Open Coal Storage in Newport News, Virginia]], the [[Virginia Air Pollution Control Board|APCD]] developed a weight (''F<sub>c</sub>'') that is multiplied by ''K<sub>t</sub>'' to include the effects of rain and fog on coal dust emissions. ''F<sub>c</sub>'' is a value between 0 and 1, with heavy fog (visibility less than 4 miles) or rain (more than 0.3 inches) giving a value of ''F<sub>c</sub>'' equal to zero, meaning ''K<sub>t</sub>'' x ''F<sub>c</sub>'' = 0''.'' | |||
=== Coal transporting and handling disturbances === | === Coal transporting and handling disturbances === | ||
'''Transportation of coal:''' The transport of coal in uncovered open-top | '''Transportation of coal:''' The transport of coal in uncovered, open-top railcars results in significant amounts of coal dust being emitted into the air by the jostling of the railcars as they travel and/or because of wind and other weather. The railroad company BNSF has conducted studies that indicate 500 lbs to 1 ton of coal can escape from a single coal car during travel along a railway.<ref>BNSF, [[:File:BNSF-Coal-Dust-FAQs.pdf|Coal Dust Frequently Asked Questions]], 2011.</ref> | ||
''' | '''Coal handling:''' Loading and unloading coal from railcars into storage piles can unsettle dust particles that are released into the air. Equipment at the terminal that manages and moves coal piles, such as bulldozers and conveyor belts, can release coal dust into the air. The transfer of coal onto ships at the port can similarly unsettle dust particles. In 1989, the APCD set limits on the emissions from each ship unloading operation, conveyor belts, bucket elevators, silo airslides, and the truck loadout system to 0.3 pounds per hour for PM<sub>2.5</sub> and PM<sub>10</sub> for each respective coal handling operation. In July 1994, this emission limit was increased to 1.6 pounds per hour. | ||
'''Handling size and frequency:''' The amount of dust varies with the amount material passing through the facilities. More coal, more dust. The age of the coal in the pile is also important. When new material is loaded onto a storage pile, its potential for dust emissions is at a maximum, and particles are easily created and released. As the coal weathers, the potential for dust is reduced. Some particles are already lost by winds and exposure to moisture causes the aggregation and cementation of particles to bulk coal surfaces.<ref name=":1" /> | |||
=== Evidence of coal dust deposition in Hampton Roads, Virginia === | |||
Soil samples soils collected in Lambert’s Point, Virginia measured elevated arsenic in local soils.<ref name=":2" /><ref>Bounds, [[:File:The Distribution of Airborne Coal Dust in Soil Profiles of Norfol.pdf|The Distribution of Airborne Coal Dust in Soil Profiles of Norfolk, VA and Its Implication for Arsenic Loading to These Soils]], Thesis, Old Dominion University, ODU Digital Commons, 2001.</ref> This research reported that soils at a depth of 4 centimeters were 7.1 percent by weight un-combusted coal with a mean arsenic concentrations of 13.3 milligrams per kilogram soil (mg/kg). The percent by weight of un-combusted coal decreased with increasing distance from the [[Coal Terminals in the Port of Virginia|Norfolk Southern Terminal]].<ref name=":2">Bounds et al., [https://link.springer.com/article/10.1007/s11270-007-9442-9 Arsenic Addition to Soils from Airborne Coal Dust Originating at a Major Coal Shipping Terminal], ''Water, Air, and Soil Pollution,'' 185, 195–207, 2007.</ref> | |||
== Documents == | == Documents == | ||
Latest revision as of 19:06, 24 November 2025
Airborne Particles
Airborne particles––also known as particulate matter (PM), particulates, or aerosols––refer to any mixture of solids and liquid droplets in the atmosphere. Particles can be directly emitted into the air or formed through chemical reactions of gaseous pollutants.
Particles are often distinguished by their size. The terms PM1, PM2.5, and PM10 are common ways particles are described, measured, and regulated, with the number indicating the diameter of the particles in micrometers. Particles can also be discussed in the terms of very-fine (PM1), fine (PM2.5), and coarse (PM10) particles, with PM10 generally referring to as dust. Particle size, composition, and shape affect how particles are regulated under the U.S. Clean Air Act and their health impacts.
Coal Dust
Coal dust is a type of particulate matter that contains coal. Coal dust particles tend to be larger in size, including PM2.5 and PM10, as well as even bigger PM that is visible with the unaided eye.[1] Coal dust is lost from the atmosphere through settling and deposition, leaving black dust films on outdoor and indoor surfaces. Coal dust contains toxic heavy metals that have serious health impacts at ambient concentrations and exposures below the U.S. Environmental Protection Agency National Ambient Air Quality Standards (NAAQS).
Coal Dust Emissions
Coal dust is produced through physical processes that wear on the brittle coal rocks during mining, transport, and storage to generate coal particles that are then uplifted to the atmosphere and carried by winds. There are various physical disturbances that can create small coal particles and uplift them into the air. The distance traveled by coal dust in the atmosphere depends on the size of particles, with smaller particles generally reaching farther distances as they settle more slowly because they less affected by gravity, and the conditions of the atmosphere. Physical disturbances influencing coal dust emissions and downwind impacts include weather and wind patterns and the transporting and handling of coal.
Wind and weather disturbances
Wind: In Southeast Newport News, coal is stored in large open piles, and these stockpiles are susceptible to wind erosion with coal particles easily becoming airborne. The wind speeds over the coal piles influence the coal dust emissions and transport downwind, with higher wind speeds associated with higher airborne particle concentrations. As wind speeds increase, atmospheric particulate matter in the air increases, and there is an overall increase in dust fluxes to the atmosphere of particulates such as coal.[2] The direction of airborne dust travel is determined by the wind direction. Higher particulate matter and black carbon concentrations have been observed in the neighboring community when winds blow from of the Curtis Bay coal export terminal in Baltimore, Maryland.[3]
In January 1987, the Virginia Air Pollution Control Board (APCB) published a study on coal dust emissions from the terminals in Southeast Newport News: Control of Fugitive Emissions from Open Coal Storage in Newport News, Virginia. As part of this study, researchers developed a mathematical formula for the effective wind forces (Kt) on the terminals' coal piles using readily available meteorological measurements.

SP is the wind speed in miles per hour, T is air temperature in °F, RH is relative humidity (%), P is the air density in pounds (lbs) per cubic feet, and μ is the air viscosity in lbs per cubic feet hours. The constant of 1.68 is the value of P divided by μ at standard conditions of 70°F, RH of 60%, and P of 29.92 inches Hg. The term T/RH reflects the tendency of the coal piles to emit particles when temperatures are high and/or RH is low.[4] Hot, dry, and windy atmospheric conditions present a worst case scenario for coal dust emissions.[5]
The APCD developed the equation for Kt to guide and optimize wet dust suppression with sprayers in Southeast Newport News. Their 1987 APCB study found a strong relationship between the daily summed Kt (ΣKt) and the amount of particles measured using a high-volume air sampler. The 1987 APCB study cited a 1984 study from the U.S. Environmental Protection Agency (EPA) Office of Air, Noise and Radiation, and the Office of Air Quality Planning and Standards as having reported that dust emissions can become significant at winds of 12 miles per hour.[5] We note that we only found a related report from 1985.[5]
Clouds, rain, and fog: Coal dust emissions are reduced on cloudy, rainy, foggy, and humid days. This is similar to the use of water sprayers for wet dust suppression.
- The presence of clouds reduces the radiant energy received by the coal piles, meaning there is less heating of the piles by the sun.
- Rain cools the piles, forms a water tension seal for fine particulate, and adds weight to larger particles meaning stronger winds are required to uplift them into the atmosphere. Rain events are associated with lower airborne coal dust concentrations, as the water droplets reduce both dust emissions and force airborne particles out of the air and back to the surface through a process called wet deposition. If significant rainfall soaks the interior of the pile, the drying process can be slow, reducing dust emissions even after the rains have stopped.[5]
- Like rain, fog cools the piles, and the very small fog droplets contribute to particle encapsulation that limit emissions.
- Relative humidity influences coal dust particle size, with higher humidity associated with larger particles as the dust particles clump together. Lower humidity increases the overall concentration and the amount of fine dust particles specifically.[6]
In Control of Fugitive Emissions from Open Coal Storage in Newport News, Virginia, the APCD developed a weight (Fc) that is multiplied by Kt to include the effects of rain and fog on coal dust emissions. Fc is a value between 0 and 1, with heavy fog (visibility less than 4 miles) or rain (more than 0.3 inches) giving a value of Fc equal to zero, meaning Kt x Fc = 0.
Coal transporting and handling disturbances
Transportation of coal: The transport of coal in uncovered, open-top railcars results in significant amounts of coal dust being emitted into the air by the jostling of the railcars as they travel and/or because of wind and other weather. The railroad company BNSF has conducted studies that indicate 500 lbs to 1 ton of coal can escape from a single coal car during travel along a railway.[7]
Coal handling: Loading and unloading coal from railcars into storage piles can unsettle dust particles that are released into the air. Equipment at the terminal that manages and moves coal piles, such as bulldozers and conveyor belts, can release coal dust into the air. The transfer of coal onto ships at the port can similarly unsettle dust particles. In 1989, the APCD set limits on the emissions from each ship unloading operation, conveyor belts, bucket elevators, silo airslides, and the truck loadout system to 0.3 pounds per hour for PM2.5 and PM10 for each respective coal handling operation. In July 1994, this emission limit was increased to 1.6 pounds per hour.
Handling size and frequency: The amount of dust varies with the amount material passing through the facilities. More coal, more dust. The age of the coal in the pile is also important. When new material is loaded onto a storage pile, its potential for dust emissions is at a maximum, and particles are easily created and released. As the coal weathers, the potential for dust is reduced. Some particles are already lost by winds and exposure to moisture causes the aggregation and cementation of particles to bulk coal surfaces.[5]
Evidence of coal dust deposition in Hampton Roads, Virginia
Soil samples soils collected in Lambert’s Point, Virginia measured elevated arsenic in local soils.[8][9] This research reported that soils at a depth of 4 centimeters were 7.1 percent by weight un-combusted coal with a mean arsenic concentrations of 13.3 milligrams per kilogram soil (mg/kg). The percent by weight of un-combusted coal decreased with increasing distance from the Norfolk Southern Terminal.[8]
Documents
- EPA Office of Air, Noise and Radiation, and the Office of Air Quality Planning and Standards, Compilation of Air Pollution Emission Factors, January 1985
- Virginia Air Pollution Control Board, Control of Fugitive Emissions from Open Coal Storage in Newport News, Virginia, 1987
- Bounds, The Distribution of Airborne Coal Dust in Soil Profiles of Norfolk, VA and Its Implication for Arsenic Loading to These Soils, Thesis, Old Dominion University, ODU Digital Commons, 2001
- Aneja et al., Particulate matter pollution in the coal-producing regions of the Appalachian Mountains: Integrated ground-based measurements and satellite analysis, Journal of the Air & Waste Management Association, 67, 4, 421–430, doi:10.1080/10962247.2016.1245686, 2019
- Coal Dust Residues on Homes in Southeast Newport News, 2024–2025 Photographs
-
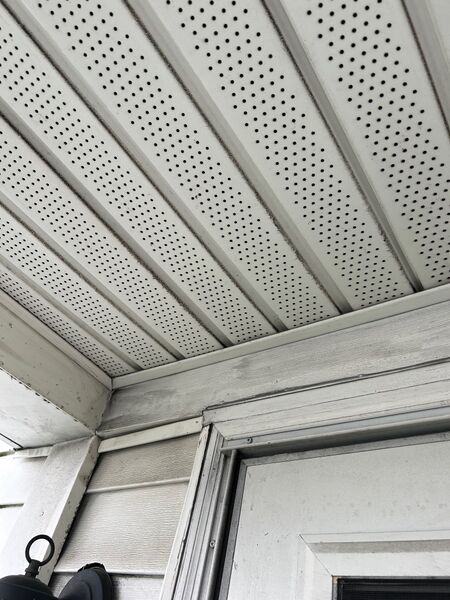 Coal Dust Residues
 -
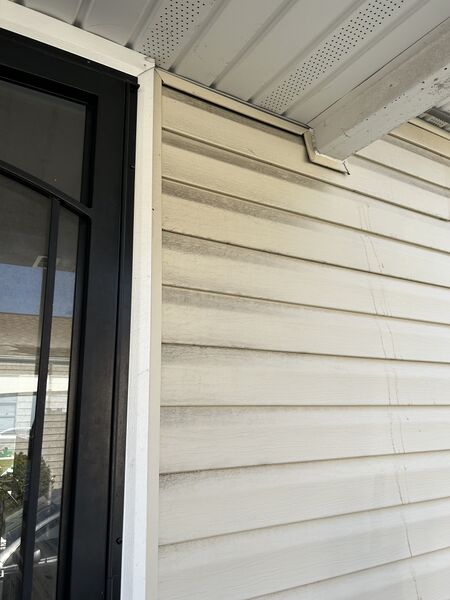 Coal Dust Residues
 -
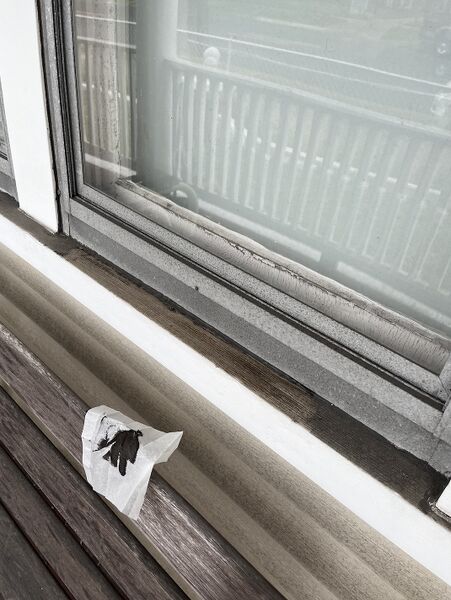 Coal Dust Residues


References
- ↑ Li, et al., Experimental Research of Particle Size and Size Dispersity on the Explosibility Characteristics of Coal Dust, Powder Technology, 292, 290–297, 2016.
- ↑ Deng et al., Characteristics of atmospheric dustfall fluxes and particle size in an open pit coal mining area and surrounding areas, Scientific Reports, 15, 9597, doi:10.1038/s41598-025-94161-4, 2025.
- ↑ Deanes et al., Relation of wind direction and coal terminal activity patterns with air pollution burden in a community bordering a coal export terminal, Curtis Bay, Maryland, USA, Air Quality, Atmosphere & Health, 18, 2805–2821, 2025.
- ↑ 4.0 4.1 Air Pollution Control Board, Hampton Roads Region, Control of Fugitive Emissions from Open Coal Storage in Newport News, Virginia, January 1987.
- ↑ 5.0 5.1 5.2 5.3 5.4 EPA Office of Air, Noise and Radiation, and the Office of Air Quality Planning and Standards, Compilation of Air Pollution Emission Factors, January 1984.
- ↑ Peng et al., The effect of moisture on particulate matter measurements in an ultra-low emission power plant, Fuel, 238, 430–439, doi:10.1016/j.fuel.2018.10.140, 2019.
- ↑ BNSF, Coal Dust Frequently Asked Questions, 2011.
- ↑ 8.0 8.1 Bounds et al., Arsenic Addition to Soils from Airborne Coal Dust Originating at a Major Coal Shipping Terminal, Water, Air, and Soil Pollution, 185, 195–207, 2007.
- ↑ Bounds, The Distribution of Airborne Coal Dust in Soil Profiles of Norfolk, VA and Its Implication for Arsenic Loading to These Soils, Thesis, Old Dominion University, ODU Digital Commons, 2001.